As a convenient means of keeping tabs on changes brought, in part, by one of America’s most ambitious urban redevelopment projects, the Atlanta BeltLine has launched interactive maps that lend data-driven insights into what’s happening across the city.
In addition to being urbanist wormholes, the tools measure fluctuations around the 22-mile trail corridor in many key areas. Those include demographic shifts, economic development, transit access, median incomes, and overall quality of life, among other categories.
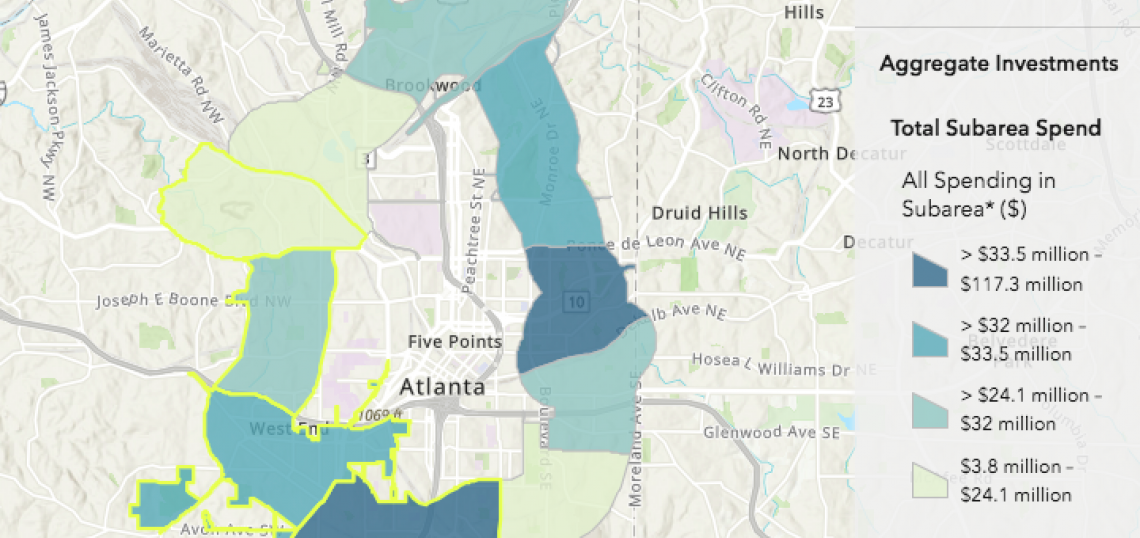
The newer of two maps, called the Investment Data Explorer, drills down on funding and progress across BeltLine subareas related to parks, housing, trails, transit and streetscapes, and arts and culture. Data was pulled from public sources such as the American Community Survey and other surveys compiled by Atlanta BeltLine Inc., as officials explained this week.
The second—and perhaps more compelling—map is the Demographic Data Explorer debuted by the BeltLine in summer 2020. It vividly illustrates shifts in population densities, incomes, rent growth, and other metrics since the BeltLine’s conception.
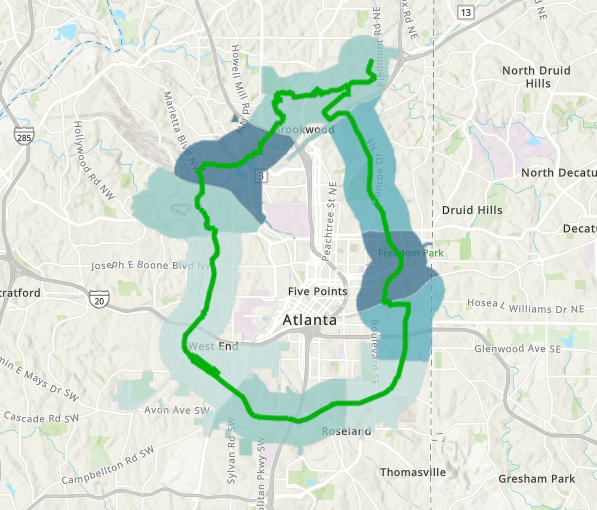 Changes in BeltLine Subareas' population between 2000 and 2018. The darkest blue represents growth of 42 to 127 percent. Lightest areas saw population numbers either remain steady or decline up to 16 percent. Atlanta BeltLine Demographic Data Explorer/Neighborhood Nexus
Both maps are part of a multi-phase partnership between the BeltLine and Neighborhood Nexus. And both, according to BeltLine officials, are meant to improve transparency and accountability in a way that anyone with Internet access can use.
Another objective is to flag economic and demographic trends “that may require policy intervention,” according to BeltLine officials.
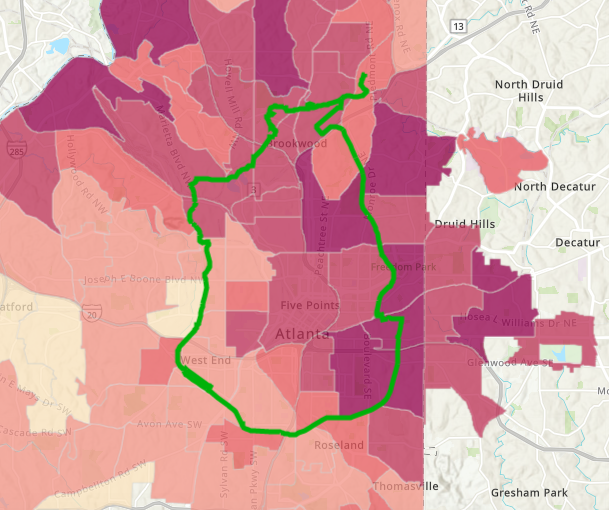 This graphic shows changes in median household incomes in BeltLine neighborhoods between 2000 and 2018. The darkest areas saw increases of between $44,000 and $77,400 (not adjusted for inflation); the lightest area saw incomes either stay flat or decline. Atlanta BeltLine Demographic Data Explorer/Neighborhood Nexus
“This new tool is here to keep track and help us pivot if we need to as we continue our progress,” Clyde Higgs, BeltLine CEO and president, said in an announcement about the Investment Data Explorer this week.
“This information,” Higgs continued, “will help us as we continue implementing efforts around affordable housing, small business support, and commercial affordability, as well as our infrastructure.”
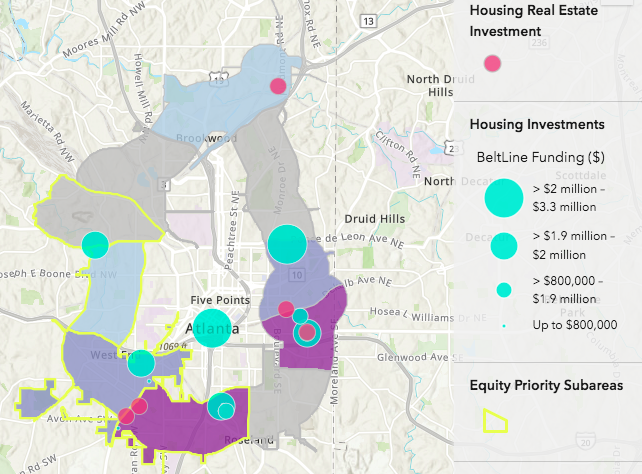 This map shows investments funded to date through the BeltLine Affordable Housing Trust Fund. Atlanta BeltLine Investment Data Explorer/Neighborhood Nexus
• Recent BeltLine news, discussion (Urbanize Atlanta)